Like velocity is one of the widely used metrics in Agile, the velocity histogram is one of the most used reports used by Scrum Masters and Product Owners. It’s simple, effective and acts as an information radiator.
I frequently interact with professionals who use my CHAMP certification course or Master Course for MS Project Agile. This came as a question from one of the aspiring CHAMPs and hence this post. Before getting into this article, I’d definitely suggest that you read the below two:
- Working with User Stories and Story Points in MS Project Agile (Scrum)
- Calculating Velocity with User Stories MS Project Agile (Scrum)
To download and use the MS Project Agile, you can use the following step-by-step installation guide.
Step-by-Step Guide: Install, Set-up and Run MS Project Agile
Now, let's start with the histogram basics.
Histogram Basics
Histograms are widely used by management practitioners – product, program, portfolio or otherwise. It can defect histogram, resource histogram, earned value measurement (EVM) histogram, among others.
Simply put, it’s a graphical representation of numerical data, and it’s usually a vertical bar chart. Nevertheless, variations exist.
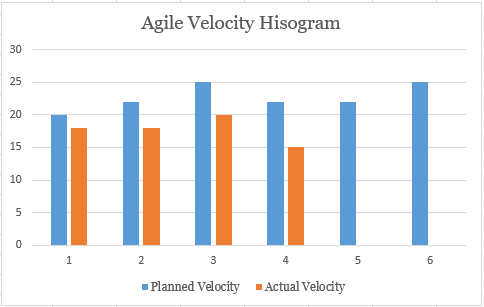
Considering Velocity Histogram, it’s a vertical bar chart showing two bars for every Sprint in a release and/or project. While one bar is for the Planning Velocity, the other one is for Actual Velocity. A simple velocity histogram is shown below.
Use A Histogram Template
To create a new velocity histogram using MS Project Agile:
Go to the Reports tab > View Reports group > New Report > Chart.
As shown above, the chart selected has a histogram figure and it’ll create a histogram with certain default fields.

In the popped-up Report Name (shown below), enter the report name as Velocity Histogram Report. This will create the report with three default fields:
- Actual Work
- Remaining Work
- Work

As you’d have correctly guessed, we are not going use to these fields, but MS Project Agile will have these fields. We are going to change these fields in a moment.
Removing the Histogram’s Default Fields
As you can understand, velocity has nothing do with the fields of Actual Work, Work or Remaining Work. Hence, we have to remove these fields. To remove these fields, select the chart area of the created report, right click and use Show Field List command from the drop-down menu.

Now, in the right pane of Field List, we have the individual fields of Actual Work, Remaining Wok and Work. Right-click on them one-by-one and use the Remove Field command to remove those fields. Now the chart area will be completely empty.
Customizing the Histogram with Velocity Fields
Next, we are going to customize this histogram (completely empty) with the needed fields. As we have seen earlier and mentioned in the two linked articles of this post, we need only two fields:
- Planned Velocity: The velocity planned for the Sprints across the releases or the entire project.
- Actual Velocity: The determined actual velocity for the Sprints across the releases or the entire project.
We are going to make use of those fields now.
In the right pane of Field List:
- Go to the Number field.
- Go to the Custom field under Number field.
- Choose Planned Velocity and Actual Velocity, both custom number fields.

As you can see in the above figure, we now have Planned Velocity and Actual Velocity fields available in the chart area of our histogram. Next, change the Grouping the field list to Group by: Sprint. This will result in the following view.

Removing the Non-Sprint Columns
As you’d have noticed above, there is a non-Sprint column and we don’t need that. To do so:
- Select the chart area.
- On the right-hand side three small icons will come-up. Select the last Filter (Funnel) icon.
- In the popped-up Values pane, deselect the category of Sprint: No Sprint.
- Click on the Apply button below.

With it, we will only the data related to Sprint 1, Sprint 2 and Sprint 3. If you have planned for more Sprints, then those data will also be available.
Adding the Data Labels
Now that we have the needed fields and only Sprints’ related velocity data, let’s customize the available velocity histogram a bit more. For this purpose, select the vertical blue bar (for planned velocity), right click, and select Add Data Labels as shown below.

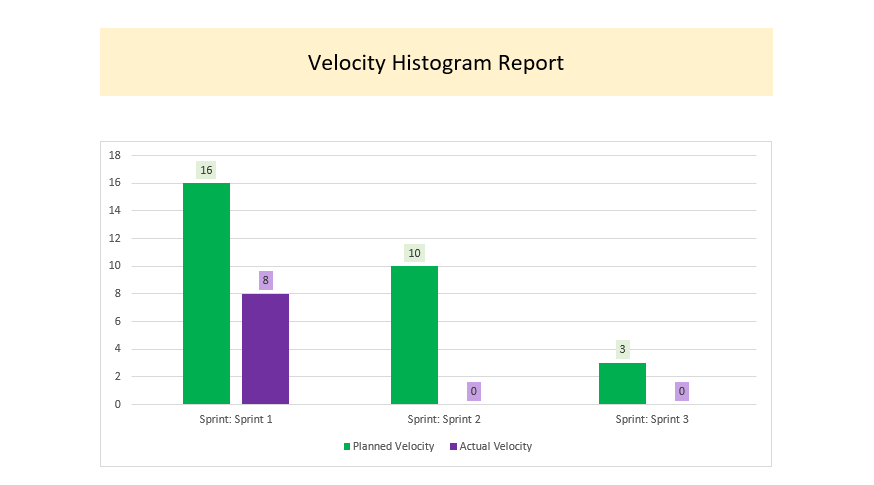
Similarly, select the other vertical orange bar (for actual velocity), right click and add the data labels. With these changes, as you can see, our first cut of Velocity Histogram for the three planned Sprints (Sprint 1, Sprint 2 and Sprint 3) is available.

Interpreting the above figure, you can see the planned velocities for Sprint 1, Sprint 2 and Sprint 3 are 16, 10 and 3 respectively, whereas the actual velocities for Sprint 1, Sprint 2 and Sprint 3 are 8, 0 and 0, respectively.
Customizing the Data Labels
Next, let’s customize this chart more with the color coding changes. As we make a few more adjustments, you will have the following view.
To generate this report, I’ve:
- Filled the vertical bars with different colors.
- Formatted the data labels with a lighter version of respective colors.
- Filled the color coding for the report label: Velocity Histogram Report.
Conclusion
MS Project Agile comes with a large number of reports, which you can use to your advantage. For example, this chart can be created in a matter of seconds, if you know the software tool well.
Also, you don’t have to update the Velocity Histogram as you keep completing the Sprints and sprint for upcoming Sprints. The histogram will take the latest data and reflect them in the report.

As shown in the above figure, we now have the inputs from Sprint: Sprint 2 and they are reflected in the Velocity Histogram report.
And of course, you can export to a PDF format to share it with other stakeholders, team members and make them available as part of your project repository.
References:
[1] Book: I Want To Be A PMI-ACP: The Plain and Simple Way, by Satya Narayan Dash
[2] Master Course: Mastering MS Project Agile, by Satya Narayan Dash
[3] Video Course: Microsoft Project Live Lessons, by Satya Narayan Dash.
No comments:
Post a Comment
Sign- or Log-in and put your name while asking queries in comments. Any comment is welcome - comments, review or criticism. But off-topic, abusive, defamatory comments will be moderated or may be removed.